Thread split from How to create a Report using c/al in navision
Hey guys,
This is an interesting topic. I am also, kind of new to Navision.
I am trying to build a report based on the items tables, but I want to get all the sales line for that item for a specific customer
so the data item I have in the report is for: Item (table 27)
now is there a way I can do on runtime something like the “inner join” in SQL, that way, I can get all the sales line records that belongs to a certain sales header (which in turn belongs to a certain customer), while at the same time specifying an item filter (WHERE clause in SQL)
You definitely need to read the development course work and/or Application Designer’s Guide.Not that people here aren’t willing to help, but you’re basically asking us to design 90% of the report for you. The questions you have are answered in the documentation. If you still have problems after that then you should ask more questions.
And you should also start a new thread for your topic [:)]
Actually, I was reading the documentation, but I am looking for a way to retrieve data from several tables (that have a relationship among each other)
to explain even further, having the following will not work for me (because i still need to link the Sales Invoice Line table to Customers & to Items)
Data Item (in the report)
Sales Invoice Header
Sales Invoice Line
also this will not work:
Data Item (in the report)
Customers
Sales Invoice Header
Sales Invoice Line
because I the second case I need to group all the sold items (by item no, item no. needs to be retrieved from the item table – for other uses which i will not discuss here because it will definitely get too complicated).
All I am asking for is: is there a way I can maybe link the Sales Invoice Line to more than 1 table:
for example:
Data Item
Sales Invoice Header, Customers, Item
Sales Invoice Line
or is there a different approach? I don’t want someone to do the report for me, just the methodology needed to build such report.
Thanks
EDITED: I am sorry but I think the actual report design I am working on is too complicated to explain here, maybe the attached picture will help clarify the report outline.
1- define a 2 dimensional array, loop through the item table and populate the first dimension of the array with the item no. (the second dimension will be used to store the sum(qty) and the sum(value)), ex:
D1 |
/
D2–> ItemA | Qty(A) | Val(A)
ItemB | Qty(B) | Val(B)
ItemC | Qty(C) | Val(C)
2- loop through all the customers get their relative sales invoice header → filter the sales invoice header according to certain criterias → get the relative sales invoice lines → loop through each line and update the array specified above with the qty/val where the item no. match
The point of me saying this is: is there any other, better, more c/side like way to do this?
because to me --if I am using SQL-- then the above would have been very easy to achieve. like:
SELECT
[Sales Invoice Line].[No_] as ItemNo,
SUM([Sales Invoice Line].[Quantity]) as TotalQuantity,
SUM([Sales Invoice Line].[Amount]) as TotalAmount
FROM [Customer] INNER JOIN [Sales Invoice Header]
ON [Customer].[No_] = [Sales Invoice Header].[Sell-to Customer No_]
INNER JOIN [Sales Invoice Line] ON [Sales Invoice Header].[No_] = [Sales Invoice Line].[Document No_]
WHERE [Sales Invoice Header].[Posting Date] >= ‘2010-01-01’
AND [Customer].[No_] = ‘CU00010’
GROUP BY [Sales Invoice Line].[No_]
ORDER BY [Sales Invoice Line].[No_]
All I am asking for here is a second opinion [:D]
Thanks
I think you may be falling into the trap that I’ve seen many new report writers fall into. You don’t have to do everything with a Data Item. You really only need a Data Item if you plan to iterate through the record set, and even then you don’t always need one.
For something like this, where you are essentially displaying data from multiple calculations (multiple date periods = multiple calculations to sum the amounts) on a single line (Period A, B, and C) you probably need to write code and load it into an array. Take a look at the Aged Accounts Receivable Report and see if that help you out.
Marshal, I think you miss-understood the requirements of this report.
Anyway altering the table to add a field and then having to update that field (even if programatically) for all the sales line, is not an option when there are other alternative.
Besides, I need to group the sales lines for a group of customers not just 1.
Thank you for the reply. I think I know what you mean, and I think I was almost thinking the same thing (the previous post where I placed a draft image for array)
Finally I was able to create the report, it’s almost what i had in mind from the start.
have an array and populate with records as I loop through them.
I am posting this here so in case some1 had the same problem he can use this solution.
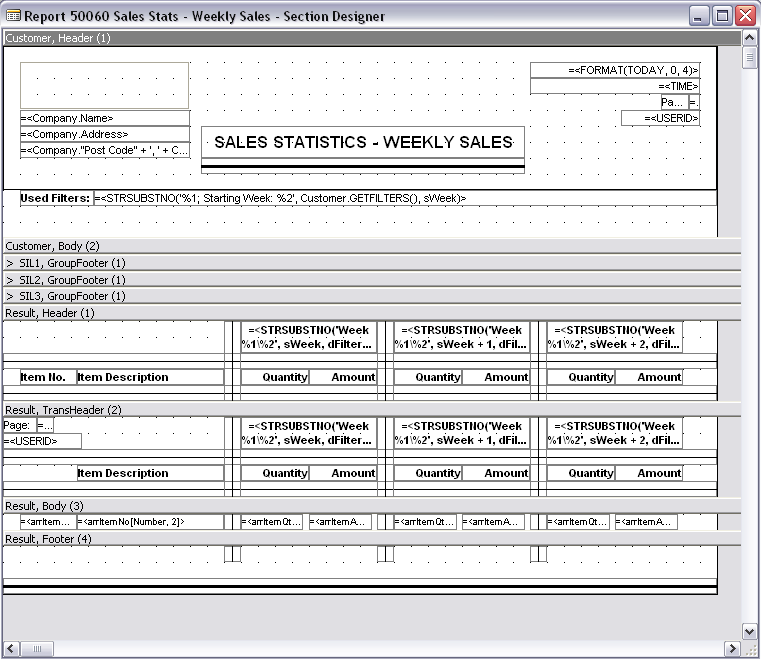
and the sections looks like: 2146.img2.bmp (1.44 MB)
The report at first loop through the item table and load all the items that I want (filter applied) into an array.
then the report cycle through all the customers (filtered) and gets their relative sales invoice lines (SIL1) – sales invoice lines are grouped by item no. and the quantity/amounts are calculated as TOTAL, then the Total quantities/amount per item are loaded into an array
SIL2 & SIL3 are the same as SIL1 but are used for different periods.
Finally, the integer data item loop through the array holding the item no. retrieved and display them along with their relative quantities.
I hope this report will help someone, somehow.
But I am still curious to find out if there is a better way to do this.
Because one of the downside for this report, is it takes a LOOOOOOT of time to generate.
for ex: a customer posting group of around 300 customers, and 400 different items. that means after retrieving and grouping all the data.
in order to fill the data in the array, the amount of loops that will be done at max can be:
300 * 400 * 3 (for periods) = 360,000 count.
so that’s quite a while.
