I am building a report with all my items and itemids.
At the moment its showing me a mega list but I want to add another column in my report where it continues with the list before going to the next page. That way the page amount of the list will reduce
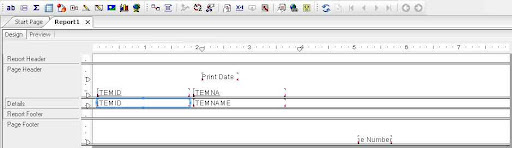
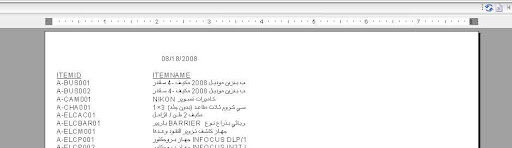
Situation now:
item id - item name | end page
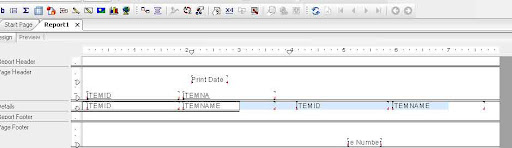
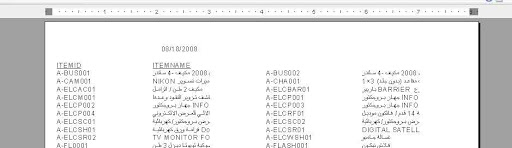
Wanted :
item id - item name item id - item name | end page
This functionality is really hard (at least for me),
I tried to do all tricks I can, but it look really hard, and I think may it is not applicable.
Actually I think about, what happen if you adust the paper setting when you print, but I didn’t do it.
the solution I’m sure about are two and both are external reporting,
A- Use crystal report it has much much more options, how to publish it is onther story.
here how to create the crystal report with multi-columns
<
Multiple columns
Instead of having your data print straight down the page, you can set up multiple columns and have the data flow from column to column.
To create a multiple-column report1. Open the report you want to format with multiple columns.
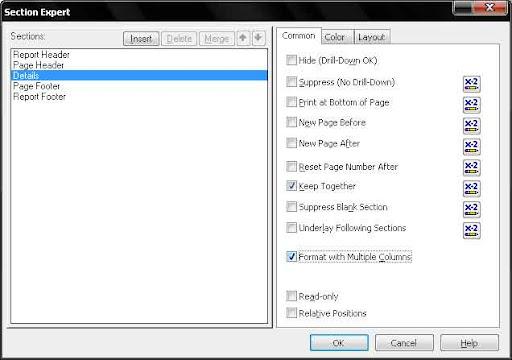
On the Report menu, click Section Expert.
Tip:Another way to do this is to click the Section Expert button on the Expert Tools toolbar.
In the Section Expert, highlight Details, and then select Format with Multiple Columns.
A Layout tab is added to the Section Expert.
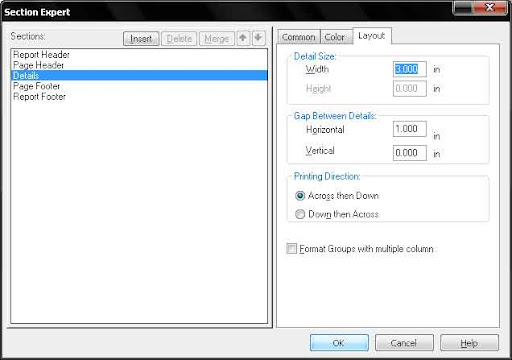
Click the Layout tab and set the Width you want your column to be.
Keep in mind the width of your paper when deciding your column width. For example, if you have three fields in your Details section, and they take up four inches of space, limit the width of the column to under four and a half inches so that all the field information can be seen.
Set the Horizontal and/or Vertical gap you want to maintain between each record in your column.
In the Printing Direction area, choose a direction.
If the report you’re formatting contains grouping, select Format Groups with multiple column.
Click OK.
When you preview the report, you’ll see that the field headers appear only for the first column. To have field headers for the second column, insert a text object.
I spend long time trying to do it using the Dynamics Ax, but unfourtuanitly it look not applicable here.
So I suggest to use crystal report, it can do it, put in mindthat publish reports is another story.
Here how that:
<
Multiple columns
Instead of having your data print straight down the page, you can set up multiple columns and have the data flow from column to column.
To create a multiple-column report1. Open the report you want to format with multiple columns.
On the Report menu, click Section Expert.
Tip:Another way to do this is to click the Section Expert button on the Expert Tools toolbar.
In the Section Expert, highlight Details, and then select Format with Multiple Columns.
A Layout tab is added to the Section Expert.
Click the Layout tab and set the Width you want your column to be.
Keep in mind the width of your paper when deciding your column width. For example, if you have three fields in your Details section, and they take up four inches of space, limit the width of the column to under four and a half inches so that all the field information can be seen.
Set the Horizontal and/or Vertical gap you want to maintain between each record in your column.
In the Printing Direction area, choose a direction.
If the report you’re formatting contains grouping, select Format Groups with multiple column.
Click OK.
When you preview the report, you’ll see that the field headers appear only for the first column. To have field headers for the second column, insert a text object.
Sorry for the latency, I thought that it was posted already.
There is a solution to the problem but it’s a dirty one. I used it to display 2 columns in inventory location barcodes report.
First of all, you have to modify fetch(). While going through the loop, you have to fetch 2 records per each loop count. In the loop, you handle the first record and then check if the next record is available. If so - handle it as well. If not - stop the loop. Second - you have to have a programmable section with fields being handled by display methods instead of having a regular section connected to a datasource. Each column has to be displayed by different display methods that return value of different (typically global) variables. You set those variables while going through the loop in fetch. If the fetch loop stops at the first (left) column and can’t fetch the record for the second column, you have to hide the fields at the right. I perfectly know how dirty and not-correct-with-the-best-practises it is, but it works quite well. It requires some time to create a report that way, but it’s the result that counts. Here is how the fetch method looks like when I used it for barcode printing - all should be intuitional to proccess to your needs. Hope that helps:
 Another way to do this is to click the Section Expert button on the Expert Tools toolbar.